Portrait of Morgan Keys

Hi, I'm Morgan

Product Designer, AI Builder

I help design teams solve their hardest use cases by combining curiosity, craft, cutting-edge tools, and a focus on how real people think and work. Whether it’s file sharing, government budgets, construction projects, or cybersecurity, companies lean on me to bring clarity and creativity to the hard problems of complex industries.

Design & AI

I believe that AI can help Design as a function reach its full potential. Modern AI tools allow designers to move into higher fidelity outputs—instead of reviewing static mockups or simple click-throughs, designers can now experiment and test at full fidelity. Designers can also build more intuition about the medium they design for, and ultimately create better, more realistic, and more innovative work.

Let's chat

If any of this sounds interesting, if you are building complex workflows for specialized industries, or if you're looking to improve your design processes for the AI era, please reach out. I'd love to talk about products, design, AI, and how we realize the potential of this new era in real, everyday workflows.

Contact me
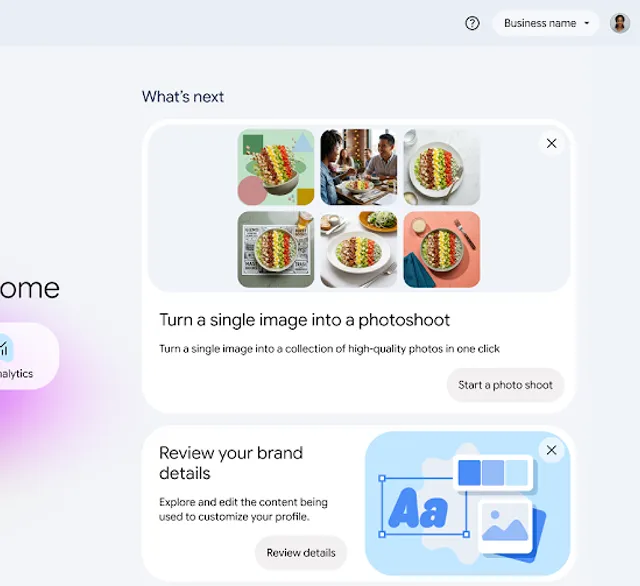
Welcome to Business Home, with shortcuts to create content, manage locations, and view analytics

Business Home

Google | Summer 2026

Helped launch a new product for local merchants that featured generative AI. Prototyped and delivered critical flows for a quick 6-week turnaround, coordinating with multiple product teams.

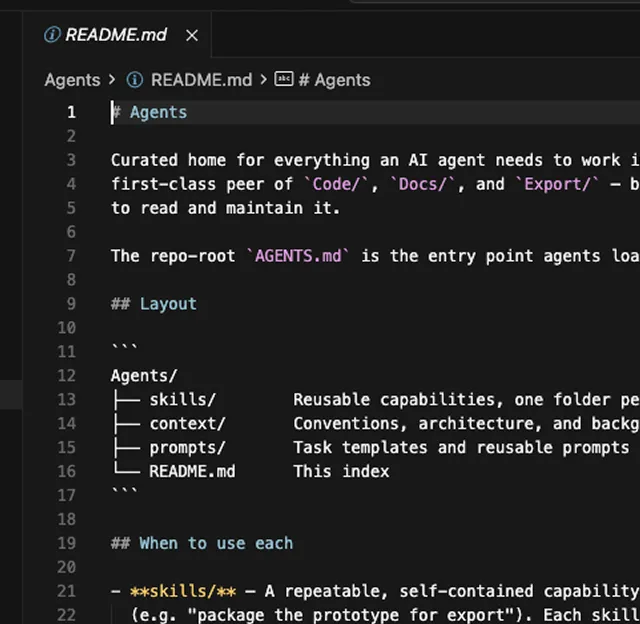
Editor showing the AI prototyping kit repository

AI Prototyping Kit

Google | Summer 2026

As part of an internal push to transform design workflows, I developed a customized AI prototyping kit. I built a well-structured codebase, using design tokens and skills to improve Gemini's outputs. The results were faster to build and more consistent, enabling deeper design review and better engineering handoff.

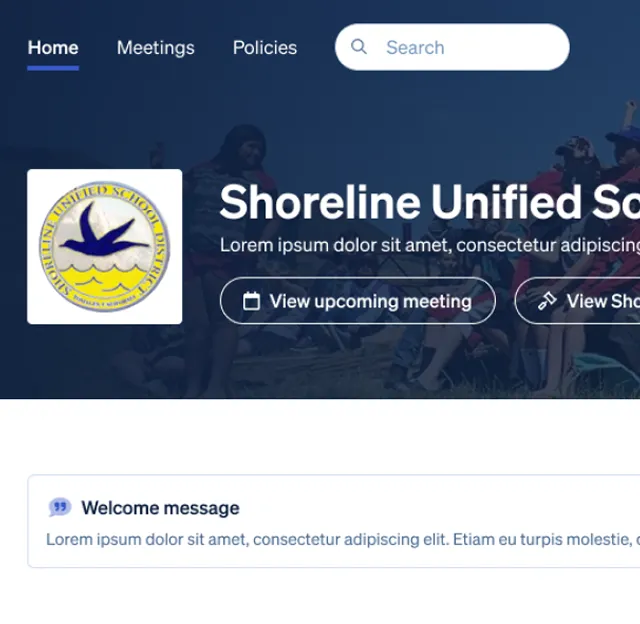
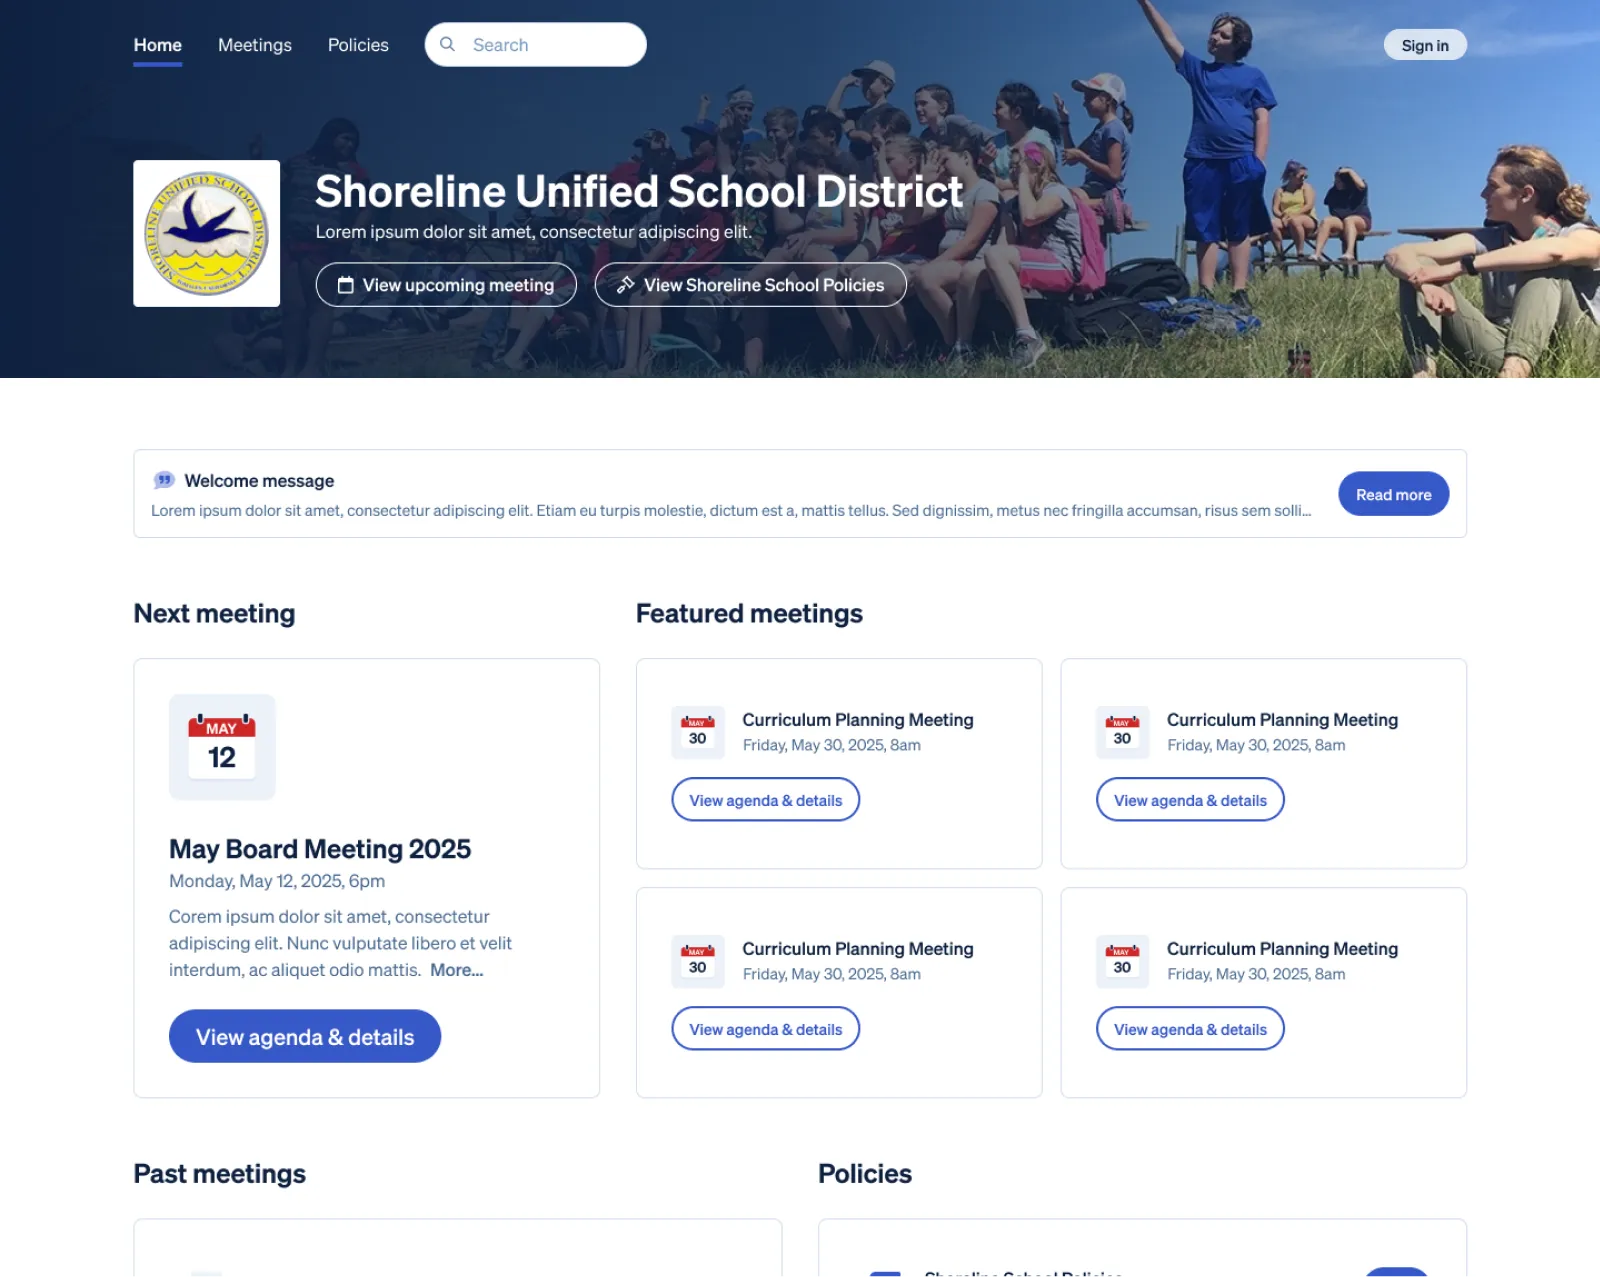
Mock-up of a school district website built on Boardable's public education sites

Public Ed Sites

Boardable | Summer 2025

Working quickly to meet a market opportunity, I crafted both a public-facing, customizable page and the admin experience behind it.

Title slide: Boardable Public Pages, beside a school district home page showing upcoming board meetings and policies

The deck opened in a new tab

Open it again

Open the deck in Figma

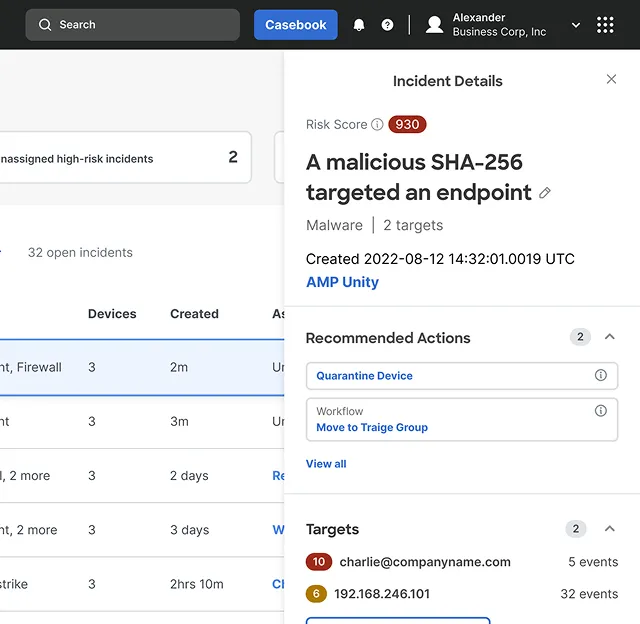
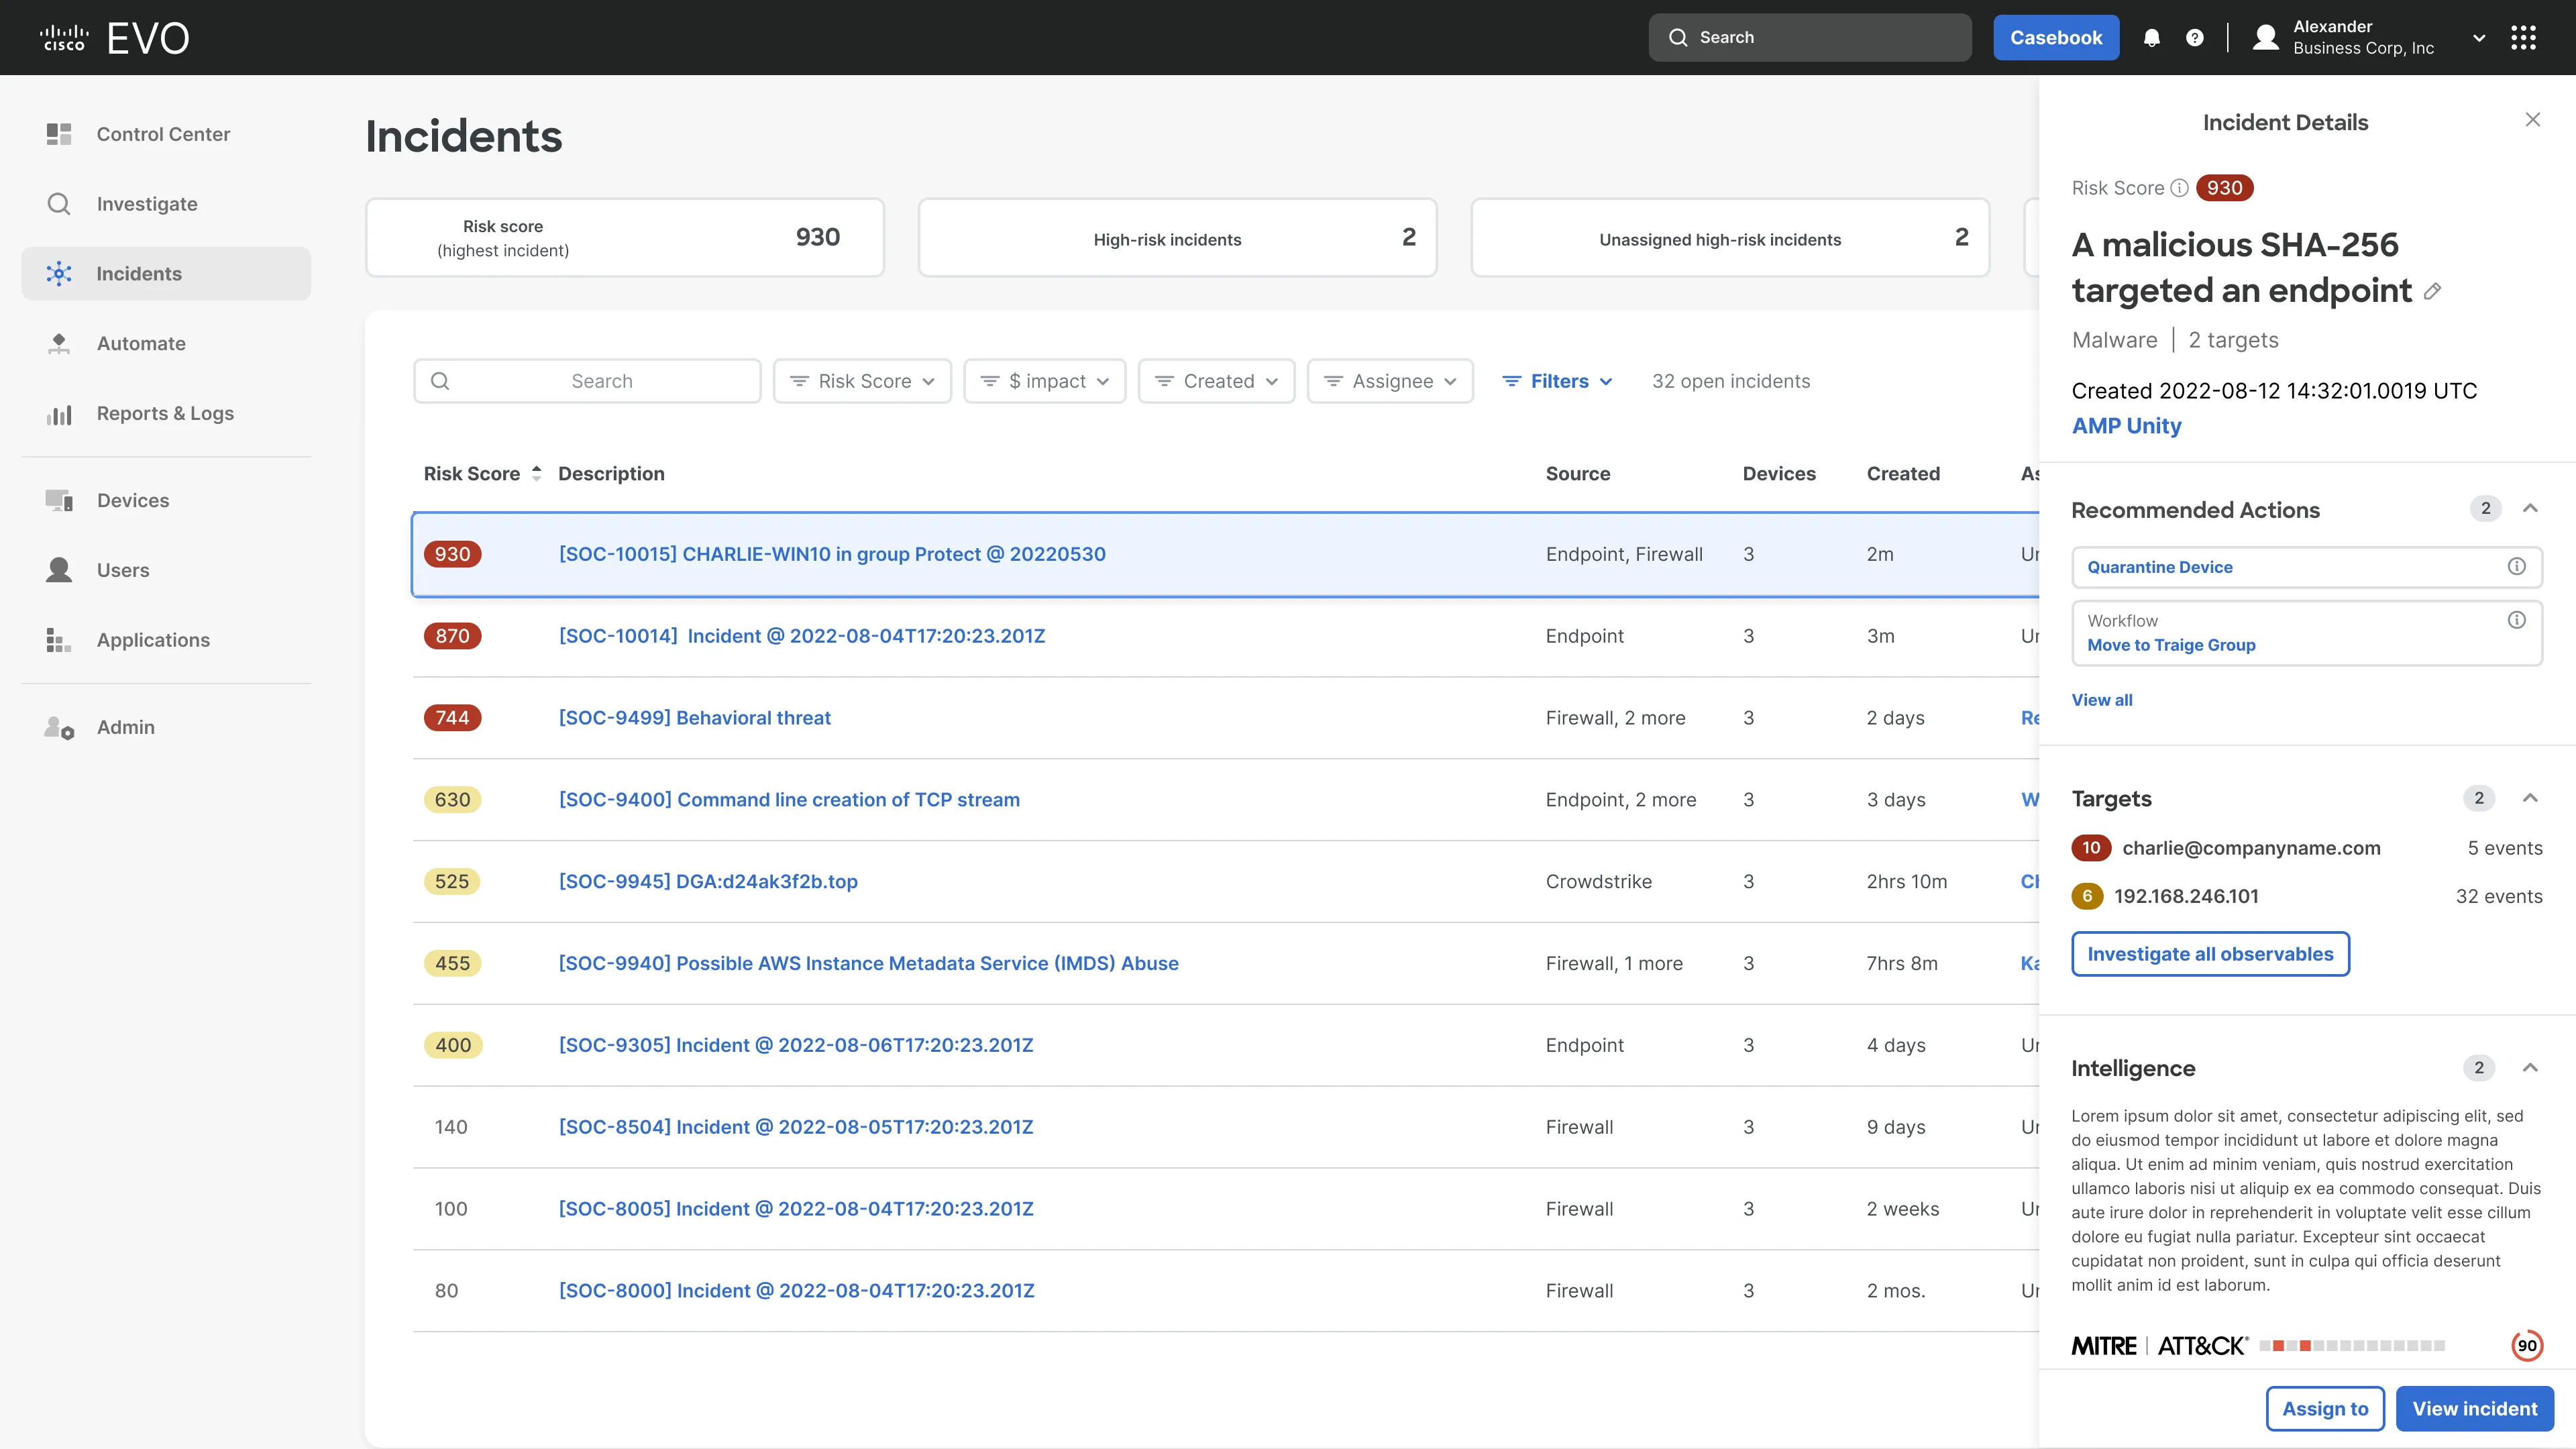
Cisco cybersecurity incident details dashboard

Cisco XDR

DesignMap | 2022

Led a team in redesigning Cisco's cybersecurity platform. Combined various complex tools into a unified, streamlined experience.

Title slide: Cisco XDR, Morgan Keys, DesignMap UX Lead, 2022, beside the incidents list with a malware incident open

The deck opened in a new tab

Open it again

Open the deck in Figma

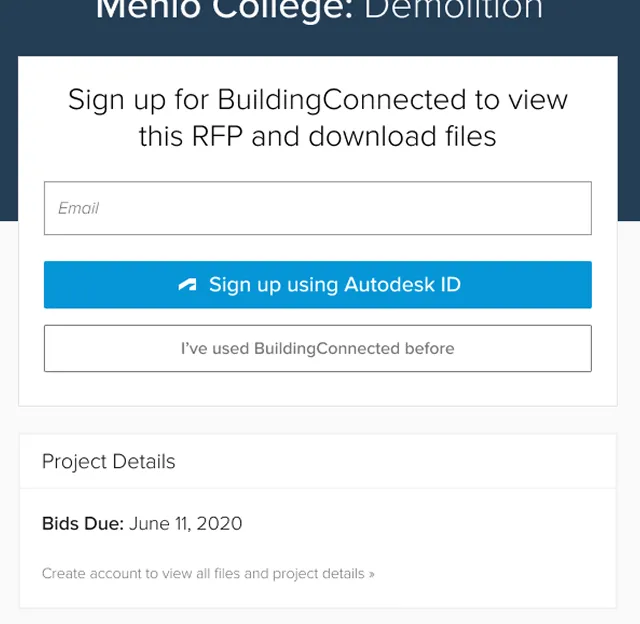
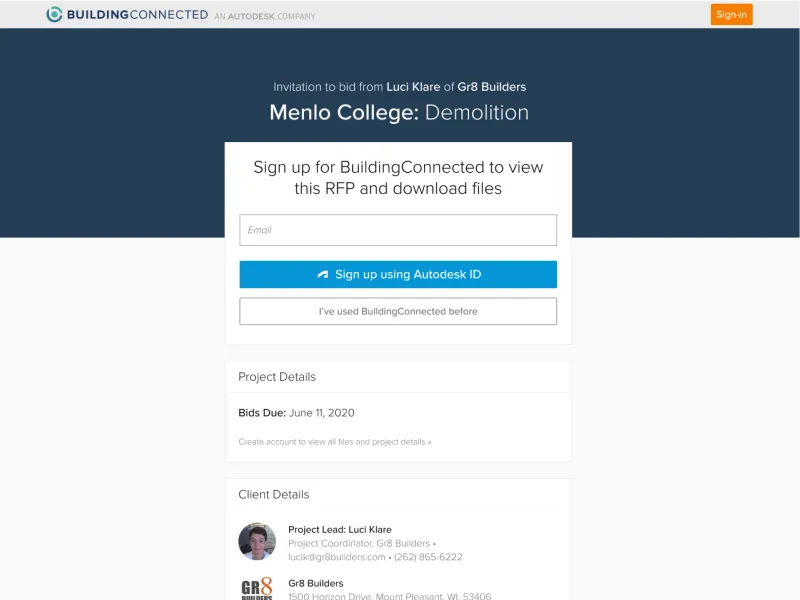
BuildingConnected sign-in screen used in Autodesk SSO

Autodesk SSO

Autodesk | 2019–2021

Summary

I led the research and design that moved BuildingConnected onto Autodesk’s unified sign-in, and planned the phased migration for its existing users.

  • 80%

    Of BuildingConnected users, across 1M+ companies, now sign in with Autodesk ID.

  • No drop-off

    No significant loss of activity and no customer complaints through the migration.

  • Still in use

    My research is still shared with teams working on unification. I presented the findings to product leaders and the division’s design and research org.

Autodesk acquires BuildingConnected

Autodesk acquired BuildingConnected in 2019. BuildingConnected focused on bid solicitation, serving both general contractors and subcontractors. By targeting the sending and receiving of requests for proposals, BuildingConnected grew organically into a large network of 1M+ construction companies, with a wealth of data on trades and pricing.

The two businesses ran on different models. BuildingConnected was a hybrid freemium product and a two-sided market: inviting off-network subcontractors led to organic growth and more value, and subcontractors and general contractors each owned their own data. Autodesk Construction Cloud primarily targeted larger enterprises, where general contractors provisioned accounts for their subcontractors and consultants and owned the data. Still, BuildingConnected fit well into a platform of point solutions, and it stood to benefit from Autodesk’s advanced tools and capabilities.

Autodesk Construction Cloud as a platform of point solutions: design tools, quantification, collaboration, project management, and BuildingConnected
BuildingConnected among Autodesk Construction Cloud’s point solutions.

“One Autodesk”

The goal for Autodesk was to create a unified construction software platform. And not only that, they were trying to create a more cohesive internal culture, centered on the idea of “One Autodesk”. During the acquisition, there had been talk of keeping BuildingConnected as a separate brand and platform (similar to, say, YouTube vs Google), but that clashed with the internal messaging, and became a source of tension. Eventually, it was decided that BuildingConnected should become fully embedded in the emerging Autodesk Construction Cloud platform.

Autodesk Construction Cloud connecting Autodesk Build, BIM Collaborate, and Docs around shared construction workflows
Autodesk Construction Cloud, connecting Build, BIM Collaborate, and Docs.

My role

I was a Senior User Experience Designer at Autodesk from 2019 to 2022, working on BuildingConnected. I planned and ran the research for this project with a cross-functional tiger team of design, product management, and UX research, and led the workshops that aligned the team on direction, research synthesis, priorities, and planning.

I also designed the critical sign-up and sign-in flows, and developed a phased plan for rolling out Autodesk ID that took both the technical challenges and users’ incentives and behavior into account.

Why Autodesk ID

Autodesk ID is the unified authentication platform for all Autodesk products. The goal of any platform is common user provisioning, centralized data, and integrated features and workflows that strengthen one another. The BuildingConnected experience stood to benefit from centralized documents, structured “Sheets” files, and integration with “RFIs” (ie formal tracking of questions and feedback). Autodesk ID was a prerequisite for all of that.

Product leadership asked us to form an experience-driven “perspective” on the best way to integrate with Autodesk ID. They needed to understand the possibility space, and they were nervous about the complexity of integrating.

The Autodesk ID sign-in page in a browser
The Autodesk ID sign-in page, the shared login every product would use.

Three possible approaches

The first step was to understand what was possible. I did a knowledge-sync with a software architect on how authentication might work. From that conversation, I identified three approaches to compare. I put these options together with examples from familiar platforms to help frame the project for my team.

Here’s a breakdown of the approaches:

  • “Linked Accounts”, people would manage two accounts that share data and permissions, adding or removing an Autodesk ID in their user settings.
  • “Twin Credentials” would let them sign in with either account, and make sign-up easy if they were already logged in.
  • “One Account”, Autodesk ID would replace BuildingConnected’s own authentication, and existing users would need to opt in, or “migrate”, to the new system.
Facebook’s apps and websites settings, an example of linked accounts from another product
Linked accounts, as in Facebook’s app settings.
Medium’s sign-in dialog with several sign-in options, an example of twin credentials from another product
Twin credentials, as in Medium’s several ways to sign in.
Google’s sign-in page, an example of one account shared across many products
One account, as in Google’s sign-in across products.

A concern over friction

Stakeholders wanted us to “stress-test” these options. One Account seemed like a massive change, but the alternatives seemed like they could introduce complexity to the experience. They wanted the team to identify which options introduced the least “friction” to the user experience.

With this in mind, I planned three rounds of prototyping and testing to explore the impacts of different options. But we also needed the right test case. With a project as open-ended as this, we needed to not only define what solutions to test, but also what user flows were most important to test.

There were various user-flows related to authentication, but in talking with the team, I urged them to focus on sign-up flows. I saw sign-up as critical for two reasons:

  1. Sign-up flows are often a point of friction because they require various inputs and choices.
  2. As a freemium, network-driven service, sign-up was critical to BuildingConnected’s growth and long-term success.

With the team in alignment, we set out to conduct user testing.

A sketch of a road splitting three ways, labeled possibility 1, 2, and 3
The choice we had to stress-test: commit to one approach, or wait.

What testing showed

For Linked Accounts, we tested a hypothetical messaging service where users were invited to view messages but had to use a secondary service to access attachments. It felt frustrating and redundant, and it would be difficult to introduce during sign-up.

Twin Credentials used the same scenario with “twin” sign-up buttons. That removed the redundancy, but users saw no reason to use the secondary sign-up.

For One Account, we tried getting users to migrate mid-flow by offering a real value proposition to real users. A clear value meant less resistance and friction. We also learned that there was little awareness of Autodesk, and that email verification was tricky.

A One Account prototype: a construction drawing with a prompt to activate an Autodesk account to use a new takeoff tool
A One Account prototype, offering Autodesk ID in exchange for a new takeoff tool.

Synthesis and insights

After testing, I led the team in workshops to analyze our data and synthesize insights. General awareness of Autodesk and its products, other than AutoCAD, was low. Some approaches were redundant and required ongoing management. One Account could be inserted almost seamlessly into sign-up. And users were unlikely to opt in to Autodesk ID, but very open to it when it was paired with a new feature.

With these in mind, we agreed to recommend One Account as the general approach. It would require a potentially disruptive prompt asking existing users to adopt Autodesk, but ultimately we agreed that a one-time disruption was better than the ongoing cognitive load and friction of the other options.

Sticky notes from a synthesis workshop, placed on a target diagram by how important they were
A synthesis workshop, sorting findings by how much they mattered.

The invitation-to-bid flow

General contractors used BuildingConnected to send invitations to subcontractors asking them to review and bid on projects. Not every subcontractor they might invite was on the network yet, so invitees without an account were prompted to sign up. That was the growth engine behind growing BuildingConnected’s network and ultimately their value as a company. But now, it would be not just an on-ramp to BuildingConnected but potentially to the Autodesk Construction Cloud.

The user-flow: invitees received an email that took them to a landing page, where they were prompted to sign up to see the full details of the project. If they entered an email that already had an account, they would just sign in. If the email was not recognized, they would need to sign up.

The original invitation-to-bid page, asking the invitee to create an account to view the request for proposal
The original invitation-to-bid page, the on-ramp for new subcontractors.

Mapping the scenarios

With Autodesk ID, we had to add more scenarios to this workflow. Authentication and sign-up would have to redirect through Autodesk for some users and BuildingConnected’s legacy systems for others. I created a matrix of scenarios, crossing whether someone had a BuildingConnected account with whether they had an Autodesk account. Users who already had both platforms would need to connect/merge their existing accounts, while other users had to create one account find/sign-in the existing account. Users who had neither would have to create everything at once.

We started with the “happy path”—the case where users were new to both platforms. If we could define an experience for new users that felt like a single unified flow, we could protect the platform’s growth potential and all other flows would be edge-cases or temporary states until final migration.

A two-by-two matrix of BuildingConnected and Autodesk account status, showing whether each user would need to sign in or sign up, and create or link an Autodesk account
Every mix of BuildingConnected and Autodesk account, and what each person would have to do.

A minimal design change

As the lead designer, I started work on the invitation-to-bid page. I focused on making subtle changes, to minimize disruption. I introduced a new, branded Autodesk button to signal the connection and the redirect to their domain.

Next, I changed the language of “Already have an account?” to “I’ve used BuildingConnected before”, making it more direct and intuitive and avoiding confusion over which account we were referencing.

Testing showed the need for an “escape hatch”, so I also added an explicit sign-in button to the header for users who might be thrown off by the new language.

The flow for new users:

  • Enter your email and click “Sign-up with Autodesk”
  • Be redirected to Autodesk to enter a password and name
  • Redirect back to BuildingConnected to fill-in final details and view the RFP.

Overall: clear, no unexpected detours or decisions. Seamless.

The invitation-to-bid page with a branded Autodesk ID sign-up button, an “I’ve used BuildingConnected before” secondary button, and an escape-hatch sign-in link, annotated
The same page, with an Autodesk ID sign-up and a clear path for existing users.

Catching existing users

With the happy path defined, I proceeded to map a flow diagram for how we would handle different user flows. Using a simple check on the input field, we could catch whether someone already had an Autodesk ID or a BuildingConnected ID and direct them as needed.

Incidentally, while mapping these flows, I identified a minor security vulnerability. Because we weren’t requiring users to verify their Autodesk account before accessing BuildingConnected, it would have been theoretically possible to “steal” someone’s BuildingConnected account. I proposed a solution and worked with a senior engineer to work out how to fix the issue.

A flow diagram of how the invitation page routes different users to Autodesk ID sign-up and sign-in paths
How the invitation page routes each kind of user into Autodesk ID.

In-app prompts

New users would be given Autodesk ID automatically, but legacy users needed to be prompted. Adopting Autodesk ID would be a small, low risk decision, but it was still a decision that needed to be presented carefully. The next step was to design interstitials and pop-ups that could catch users at the right time.

The interstitial appeared to users signing in from any touch point, not just invitations to bid. Based on testing, we knew that users needed some sort of incentive or reason to convert—prompts to convert without a clear rationale were ignored. Discussing with the team, we identified some value props: enhanced security features available in the Autodesk platform and the aspirational appeal of the evolving unified platform (alluding to future integrations).

Users who didn’t see or ignored the interstitial could also be prompted with a simple pop-up (a teammate designed the pop-up initially, and I carried it forward). We exposed the prompts progressively, choosing cohorts of friendly companies in good standing and showing the prompts to increasingly larger groups.

With these pieces designed, we had all scenarios covered. But for a sensitive context like this, we also needed a plan.

The sign-in interstitial: “Take 30 seconds to set up Autodesk ID,” with an Enable Autodesk ID button and an option to do it later
The sign-in interstitial: 30 seconds to set up Autodesk ID.
A “Get Autodesk ID!” pop-up over the BuildingConnected bid board
A later pop-up, for people who skipped the interstitial.

A phased release plan

There were many moving parts in this project and many little touch points. I could see that we needed a long-term plan. I came up with a multi-step plan for release and migration, and presented it to my team for feedback and buy-in. The plan had no dates. There was a lot of uncertainty around which future integrations we wanted to build and how users would react to the introduction of Autodesk, so I proposed a flexible timeline based on thresholds, not arbitrary dates.

Phase I, Groundwork, gave engineering time to build basic infrastructure and meet the technical requirements for integration. I used this phase to design the invitation and prompt flows while engineering implemented back-end infrastructure.

Phase II, Pilot, would manually enable Autodesk ID for friendly customers we knew would be open to migrating. We would test integration prototypes with them and monitor for friction and UX blockers. The goal would be to launch our MVP Autodesk integrations, in hope that we could use those to incentivize broader adoption.

Phase III, Promote, would actively encourage people to opt in, using our high-value integrations as the incentive, until adoption met an agreed upon threshold (e.g. 80% of users).

Phase IV, Migrate, would set a deadline once the bulk of users had moved and there was enough value to justify disrupting the remaining users. That meant an email and communications plan, an in-app countdown, removing the ways to sign in with BuildingConnected, and flows to catch users who missed the deadline.

The four-phase release plan, Groundwork, Pilot, Promote, and Migrate, gated by technical, UX, and adoption requirements, starting in January 2020
The release plan: Groundwork, Pilot, Promote, and Migrate, gated by thresholds rather than dates.

The broader unification effort

Autodesk ID was a first step in a much broader process. During my time at Autodesk, I also explored projects across various products, whether to adopt a common domain, and integrating documents and Sheets. A project was a central container of data and work in construction, but it worked very differently in different products, and the two companies’ business models turned out to have a huge impact on how projects and their data were handled. I analyzed the idea of a project across Autodesk Construction Cloud products, and mapped how a project’s dynamics, use cases, and relationships change over the lifecycle of a real-world construction project. That analysis showed how the conflicting business models were blocking unification, and how better models could improve use down-market.

I also identified problems caused by separate domains, such as sign-in sessions falling out of sync, and presented the problem and potential fixes to product leadership. I eventually became something of a unification advocate. On a unification “road show,” I met with stakeholders from all over the division, sometimes learning about other products and other times explaining the challenges of unification and advocating change. I also presented my findings to product group leaders and to the division’s full design and research org.

A diagram of Autodesk ID and BuildingConnected sessions falling out of sync because the two are on different domains
Separate domains let an Autodesk ID session and a BuildingConnected session fall out of sync.

Impact

Today, 80% of BuildingConnected users sign in with Autodesk ID, with no significant drop-off in activity and no customer complaints through the migration. At the time of launch, BuildingConnected had over 1 million companies in its network and $56 Billion in bids passed through the platform each month.

This work was critical for integrating with the Autodesk platform, which ultimately enabled high-value features such as Autodesk document storage and viewing of special. For years, the BuildingConnected product manager I worked with shared my projects-research artifacts with teams grappling with unification questions.

As of 2026, the BuildingConnected platform is finally being absorbed into Autodesk Forma, the final phase of a long, complex process that started with Autodesk ID.

Autodesk 2020

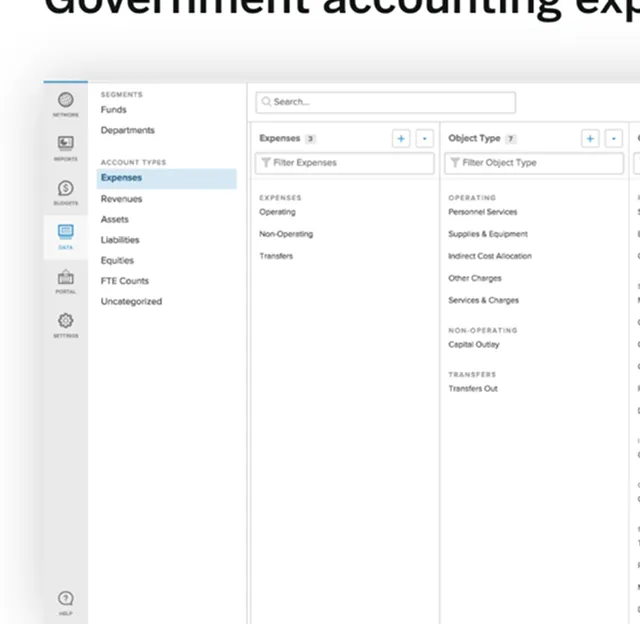
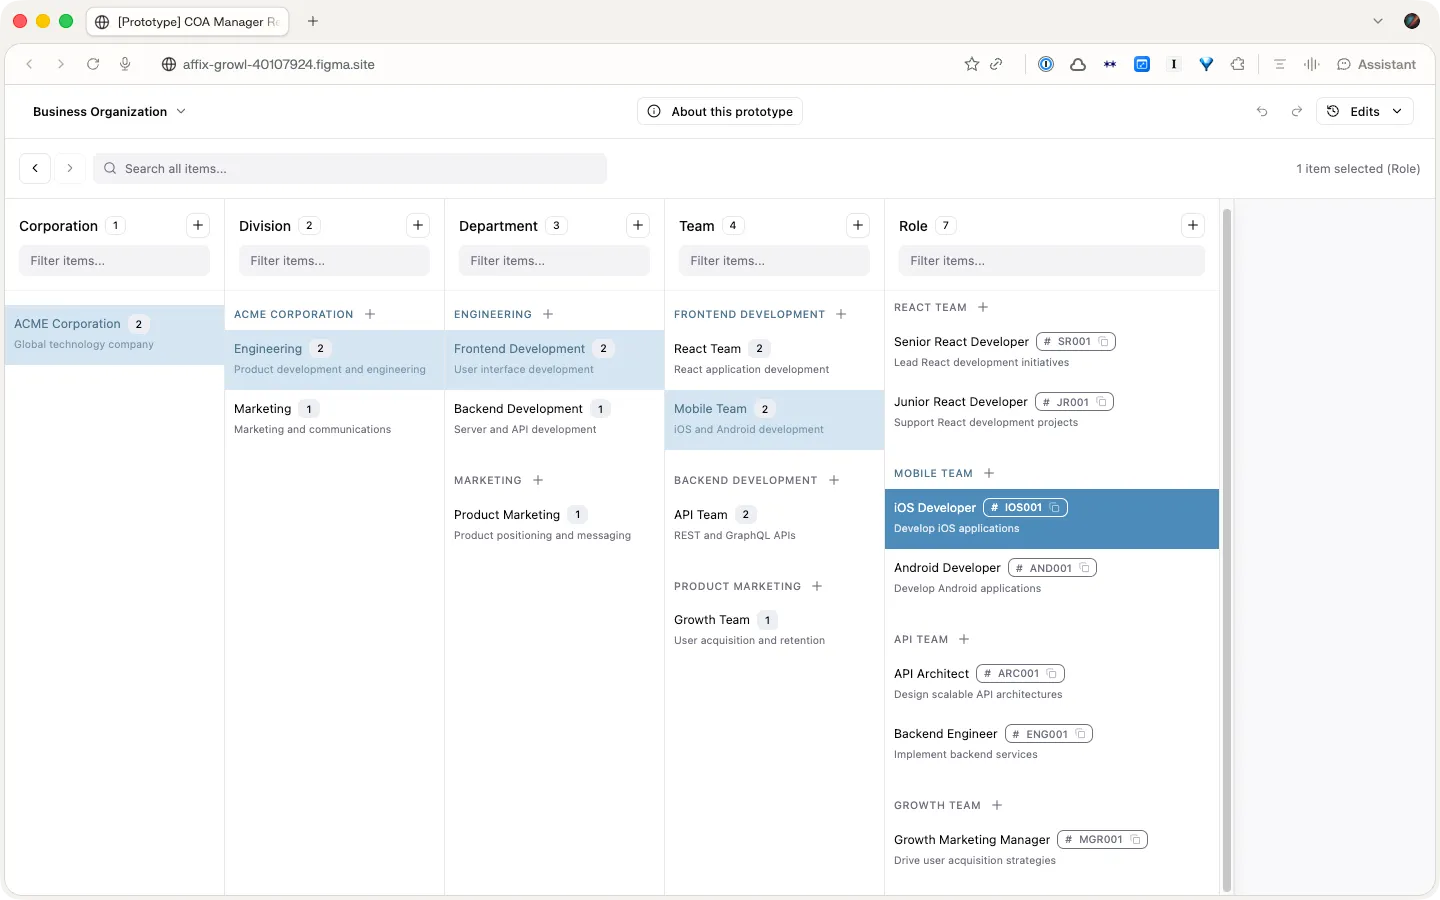
The OpenGov chart of accounts manager

Chart of Accounts

OpenGov | 2016

Summary

Redesigned the tool local governments use to structure their financial data. Months of research into an esoteric accounting concept led to the “slot machine” — a dynamic, spreadsheet-like view of nested taxonomies that users picked up naturally and that earned OpenGov a patent.

Public servants

OpenGov's primary users are the public servants who run local governments. This includes elected officials like mayors, but the more common day-to-day users are department heads, analysts, accountants, and finance directors. My work primarily focused on accounting and finance users. These individuals are risk-averse and detail-oriented, yet they take pride in their work, viewing it as their solemn mission to present financial data in a way that is understandable to their staff and the public.

A finance director
Finance directors and accountants were the day-to-day users.

Financial transparency

Local governments upload large amounts of data to OpenGov on a quarterly or monthly basis, using the platform to share interactive reports both internally and publicly with the citizens they serve. Due to the complexity of financial data, the usefulness and accuracy of these reports heavily depend on how the data is categorized. Sophisticated categorization schemes are created in enterprise resource planning systems and must be mirrored in OpenGov. The categorization scheme for an organization is referred to as a "chart of accounts."

An OpenGov transparency report
A public transparency report. Its accuracy depends on how the data is categorized.

Taxonomies

A chart of accounts is a long-standing, esoteric accounting tool, essentially a series of taxonomies. An easy analogy for the average person would be the classification of animals: just as scientists categorize animals into groups, accountants do the same for transactions. However, in accounting, multiple taxonomies are used for each transaction, and the structure can vary from one organization to another or even based on the type of report. A small government might use three taxonomies, each with 2-3 levels, while more sophisticated governments could have 4-5 taxonomies with up to six levels. We often encountered charts that tracked tens of thousands of types.

A taxonomy of animals
The animal kingdom, as a stand-in for how accountants group transactions.

The legacy solution

OpenGov already had an existing tool for managing charts of accounts, built as an MVP in the early days of the startup. The tool made certain implementation assumptions that required these taxonomies to be handled separately. It also used a folder-like interface that did not accurately represent the data and, due to a lack of error handling, allowed users to make nonsensical edits and accidentally corrupt their data. When I was assigned to redesign the chart of accounts manager, there were aspects we couldn't change, but we could improve the user interface.

The legacy chart of accounts editor
The legacy editor treated each taxonomy like a folder tree.

Listening and learning

Aside from a background in math and a curiosity for data structures, I had little relevant experience for this project. My first step was to listen and learn. Luckily, we had retired finance directors on staff with decades of experience, as well as a team of technical support staff who interacted with customers daily, training them and solving technical challenges. I set up learning sessions and made countless desk visits. I also took the opportunity to join customer calls to learn directly from customers, listening for the kinds of questions they asked Customer Success and then asking questions of my own.

Becoming an expert

Given the complexity of this tool and the data it managed, I had to grapple with the subject matter. I began diagramming concepts, initially just to help articulate ideas to myself. I shared these diagrams with the Customer Success teams for feedback, prompting great discussions. We also realized these documents could serve as training tools, as I was not the only team member struggling to learn these concepts. Ultimately, the Customer Success team began distributing these documents to customers as well. Over the course of this project, and in my later work, I became one of the company's chart of accounts experts.

Diagrams explaining chart of accounts concepts
Diagrams I drew to learn the subject, later handed to customers as training.

Early concepts

Once I felt I was beginning to grasp the concept of a chart of accounts, I looked for ways to better represent it in the interface. Inspired by a popular data visualization library, I mocked up an interface that represented taxonomies as a dendrogram. It was an exciting approach, offering an unprecedented bird's-eye view of the chart of accounts. However, there were serious problems. First, the tree-like organization made it difficult to view the entire categorization for a type—something critically important in a taxonomy. Second, illustrating the connections meant that text was not packed tightly, making it hard to see thousands of nodes in a readable way.

An early dendrogram concept
An early concept that drew the whole chart as a dendrogram.

Back to the drawing board

One of my favorite, underappreciated research methods is artifact analysis. By examining the files and objects that people use to perform their work, you can gain valuable, tacit insights. I analyzed the spreadsheet files that users were uploading to OpenGov, trying to understand how information was laid out. I realized that spreadsheets did a great job of displaying taxonomies in a compact, readable, and easy-to-manipulate way. The only drawback was that the row-column grid required labels to be repeated when many categories were grouped under a parent, leading to visual noise. It occurred to me: what if we could create something dynamic?

A customer spreadsheet used for artifact analysis
A customer spreadsheet: compact, but parent labels repeated down the rows.

A new concept

Imagining a dynamic spreadsheet with columns automatically scrolling to show relationships, I mocked up the new concept. It was a challenging idea to communicate abstractly, so I tried various methods to explain it, including Framer, animations, and even simple HTML/CSS prototypes. The concept became known as the “slot machine” due to the way it synchronized. Eventually, I paired with an engineer who built an early alpha version for testing.

The “slot machine” concept
The “slot machine,” with columns that scroll together to show relationships.

Usability testing

I traveled with OpenGov account managers to visit local customers and test with live users. I used a short pre-interview script and ran a standard task-based usability test. The goal was to assess if users could understand what the interface was communicating and if they could successfully perform basic editing and navigation tasks.

The results were very positive. Especially considering the unique approach to visualization, it was exciting to see how naturally users picked it up.

These tests validated the concept, but they only covered basic tasks. We later learned the heaviest use came from people editing hundreds of accounts at once.

Working with Customer Success

OpenGov is an enterprise sales company, which means that account management and Customer Success play a huge and ongoing role in the customer experience. In fact, many customers, due to busy schedules or a lack of tech savvy, relied entirely on Customer Success to handle the technical work necessary to set up their accounts. This included working with the Chart of Accounts Manager.

And though I had spent many hours speaking with and learning from Customer Success, it became clear that they were the true power-users and I would need to learn their day-to-day workflows as well.

Based on learnings from 1-on-1 work sessions, I designed several features that enhanced their ability to search and make bulk-edits. One such feature allowed users to apply multiple filters at different levels, meaning they could quickly target a set of items and then easily move them to a new parent.

These features opened the door to the tool’s ultimate success.

Impact

The new design replaced the old editor and became the workhorse of the OpenGov platform. It enabled Customer Success to efficiently support customers and make chart of accounts manipulation accessible to more end-users.

Many users reported moments of delight when trying the new tool. They seemed to have small epiphanies, as if to say, “oh, right, that’s how it works.” In the world of accounting software, this may be one of the only tools that is actually fun to use.

The tool also made some surprising achievements. First, even though the tool was typically packaged with the platform, one customer opted for a special contract, paying $42,000 for just the Chart of Accounts Manager. Second, the novelty of the user interface combined with some of the technical achievements in its engineering won OpenGov a patent (US 10,552,995).

The alpha build in testing
The alpha build, tested with local customers.
The rebuilt prototype
The same interaction, rebuilt from memory in Figma Make.

OpenGov 2016

What do you want to chat about?

Case study decks

Interactive demos

OpenGov chart-of-accounts manager prototype

OpenGov CoA Manager

Figma Make

Simplified for general audiences. Explore the unique interaction paradigm that earned OpenGov a patent.

OpenGov Network prototype

OpenGov Network

Figma Make

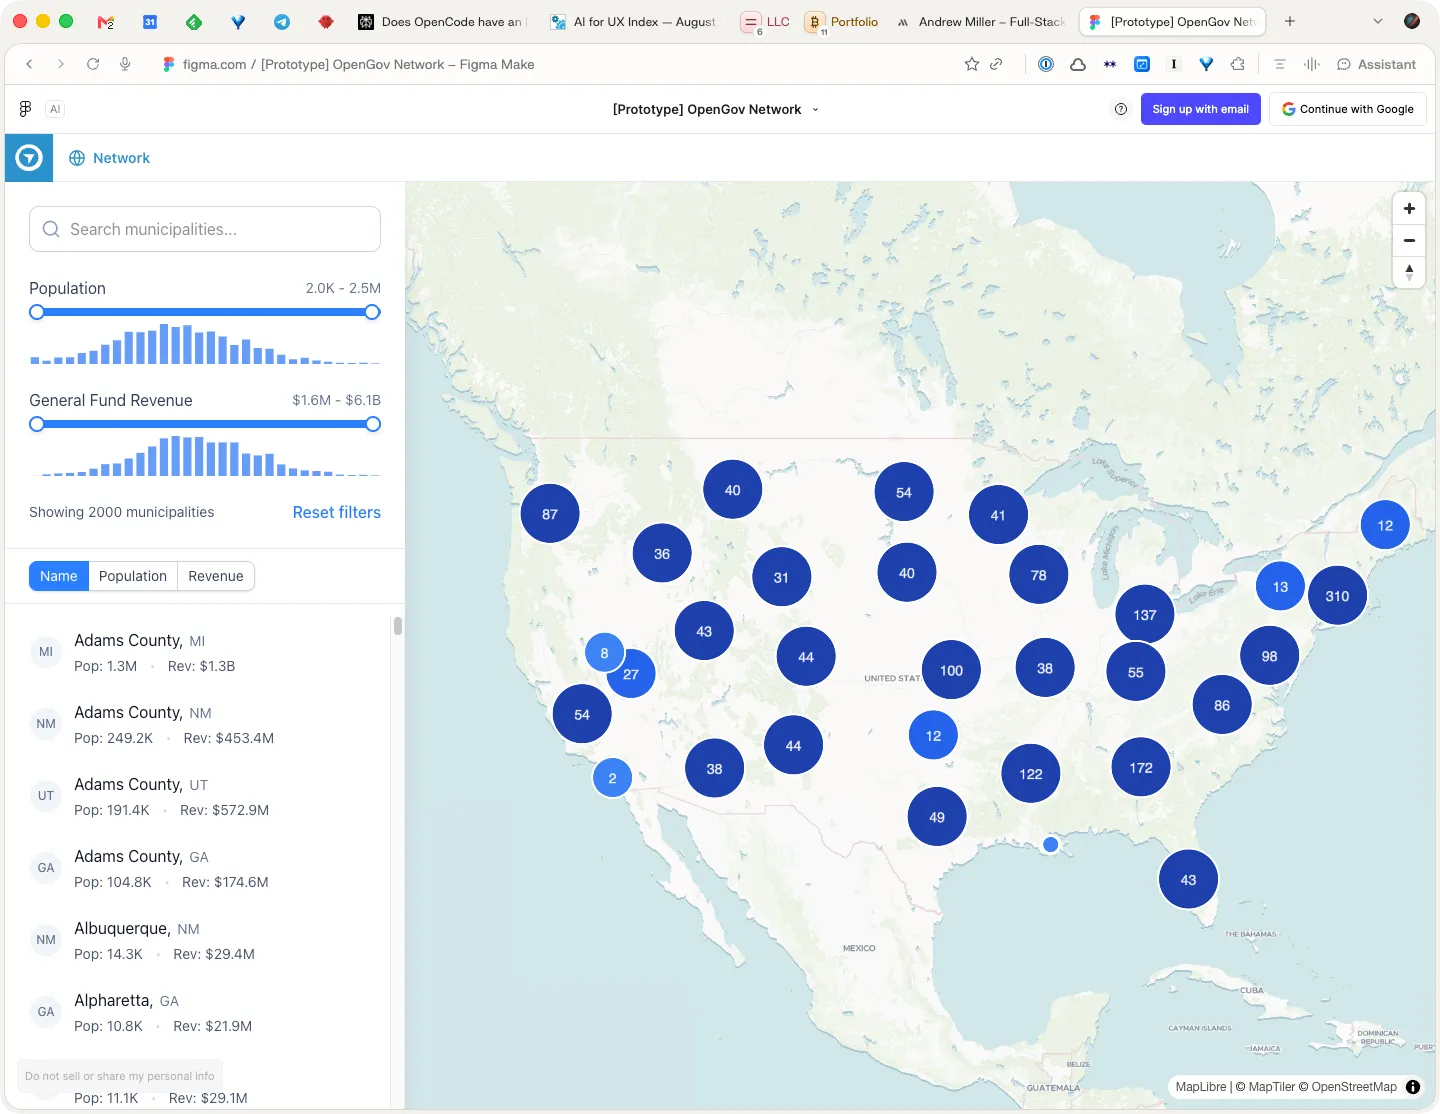
A recreation of the MVP I designed at OpenGov — a way to explore the OpenGov Network and browse municipal metrics.

Background

Career path

  • 3 scaling-stage startups, multiple exits
  • Large teams: Autodesk and Google
  • Strategic work at DesignMap
  • Long track record of building tools and design systems

Academic background

  • Dual Bachelor's degrees in Math & Creative Writing
  • Master's from University of Michigan's School of Information (Human-Computer Interaction)
  • Master's specialization in decision science
  • Interests in statistics and agent-based modeling

Earlier work

Boardable Surveys

Built a survey product that expanded Boardable’s platform, and designed a new navigation model to support distinct products.

Opened a new line of business and expanded Boardable from a catch-all app to a platform.

Boardable, 2025
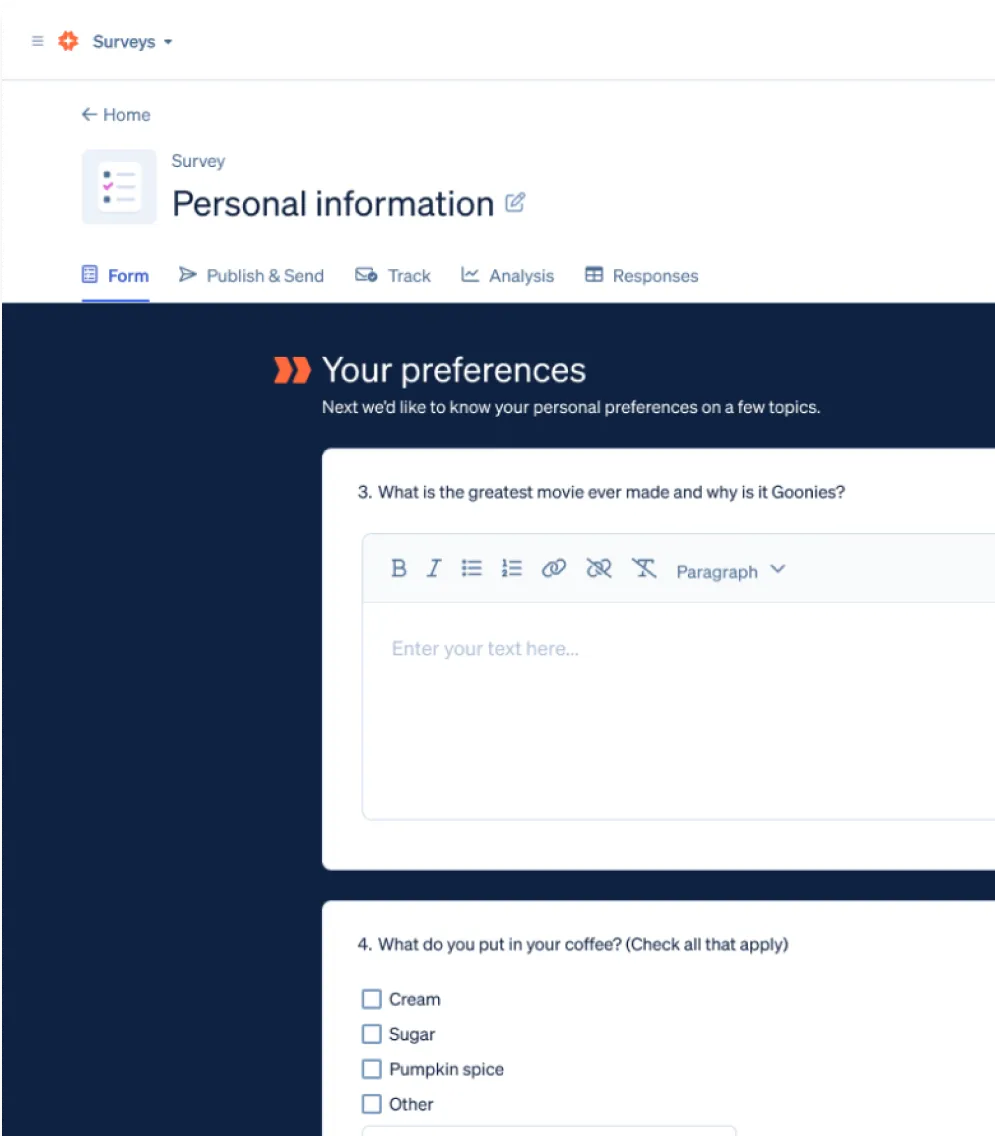
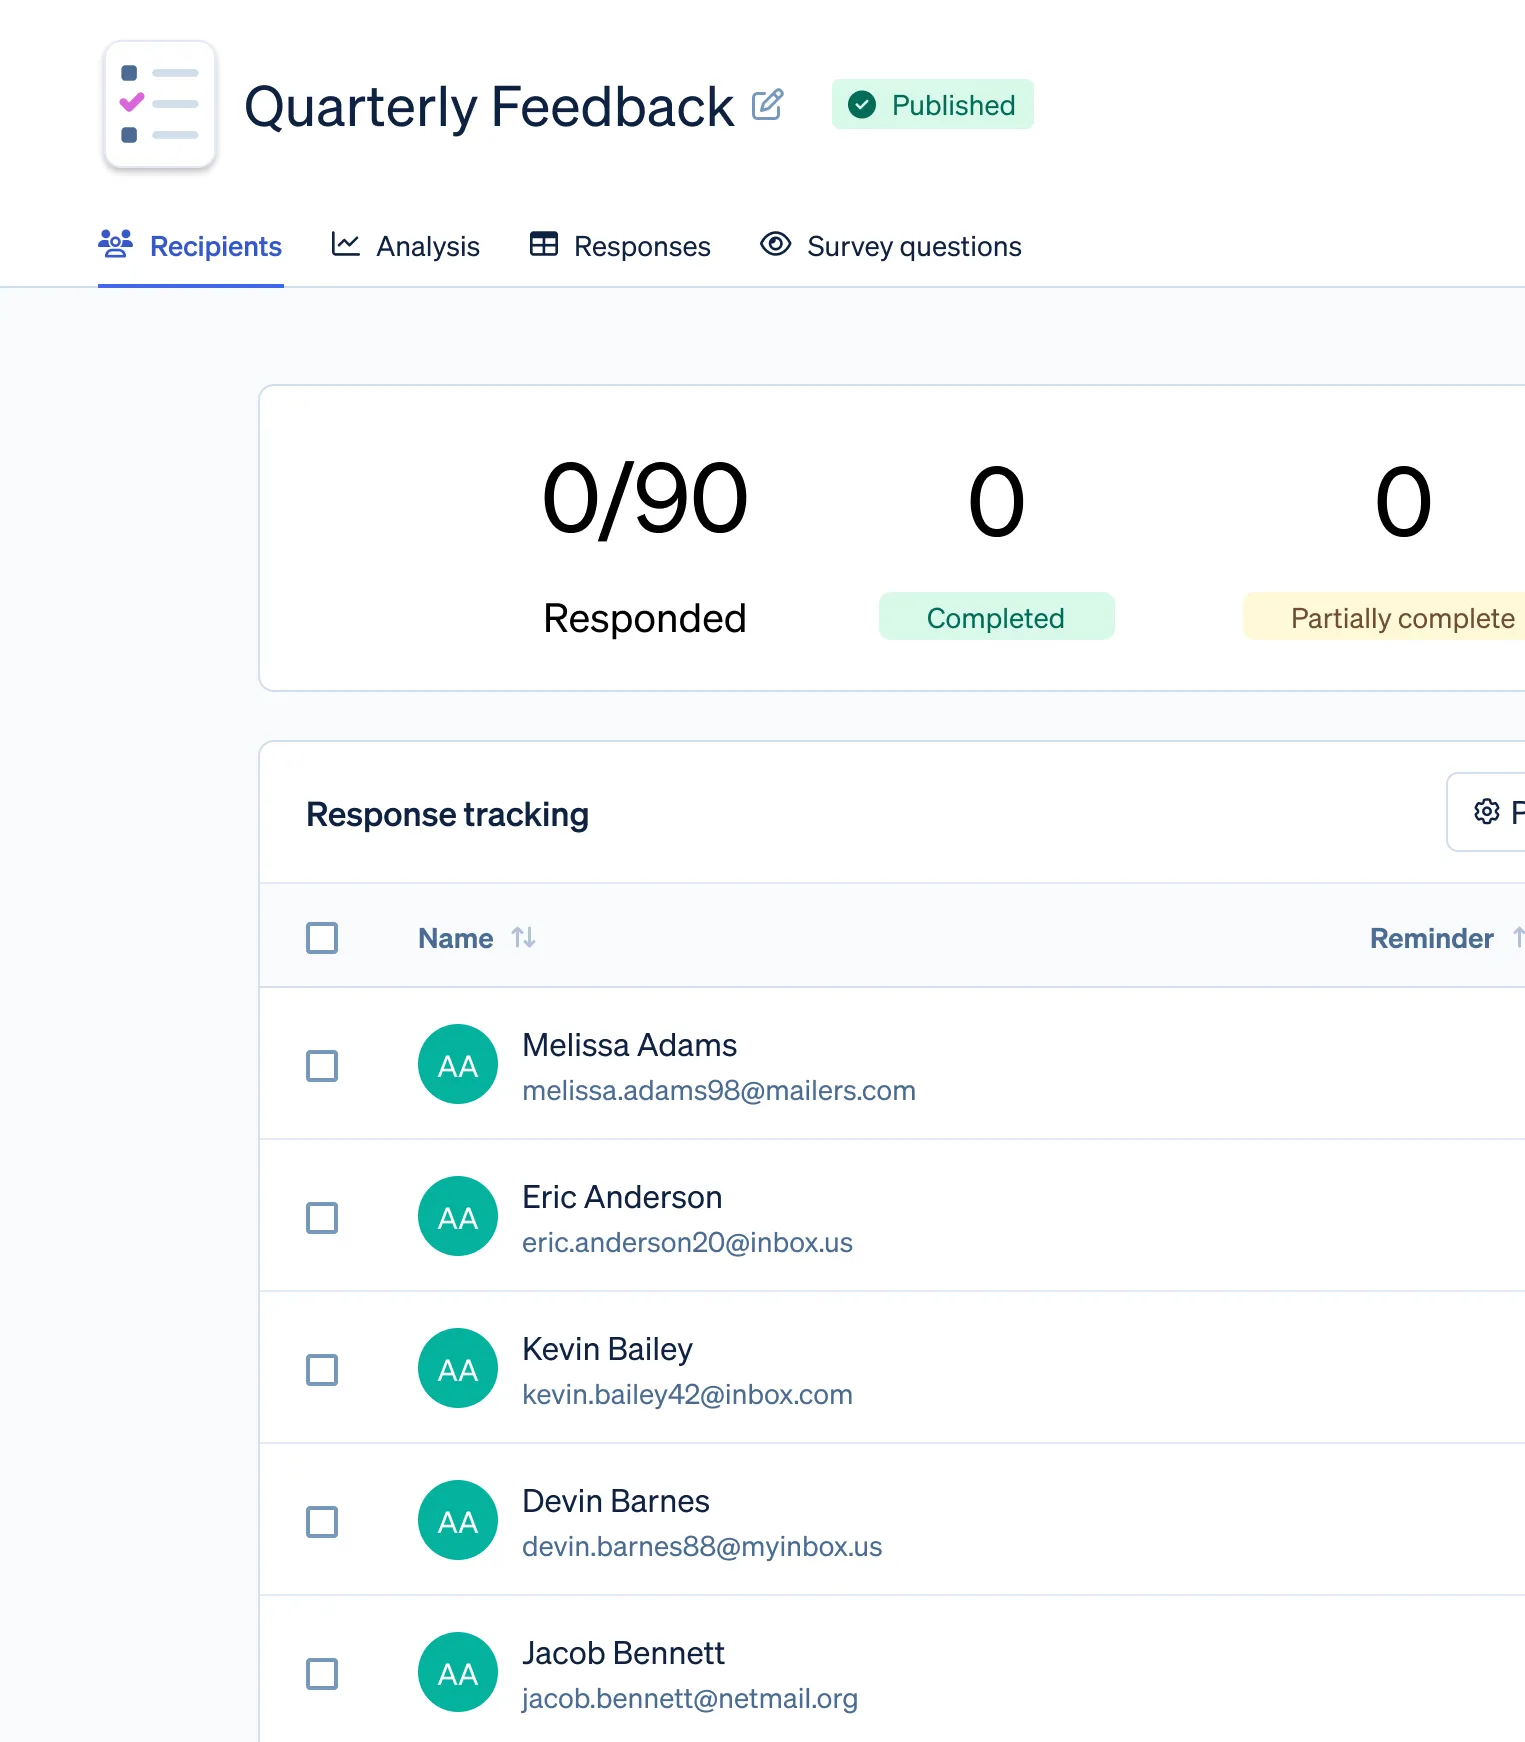
Boardable Surveys interface
Boardable Surveys feedback dashboard

AI Minutes / AI Meeting Assistant

Designed a flow for generating, reviewing, and editing AI-written meeting minutes, plus an in-meeting AI assistant.

Boardable, 2025
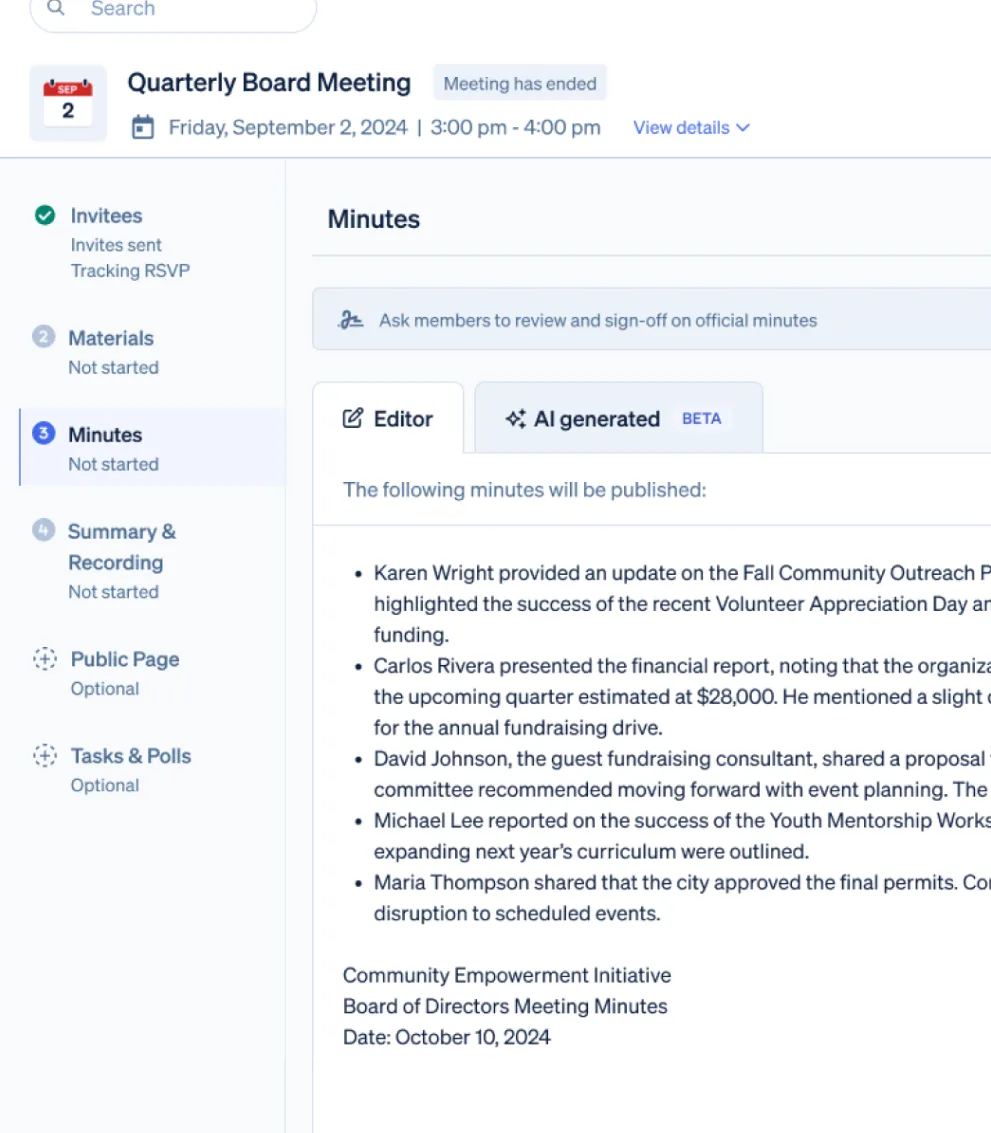
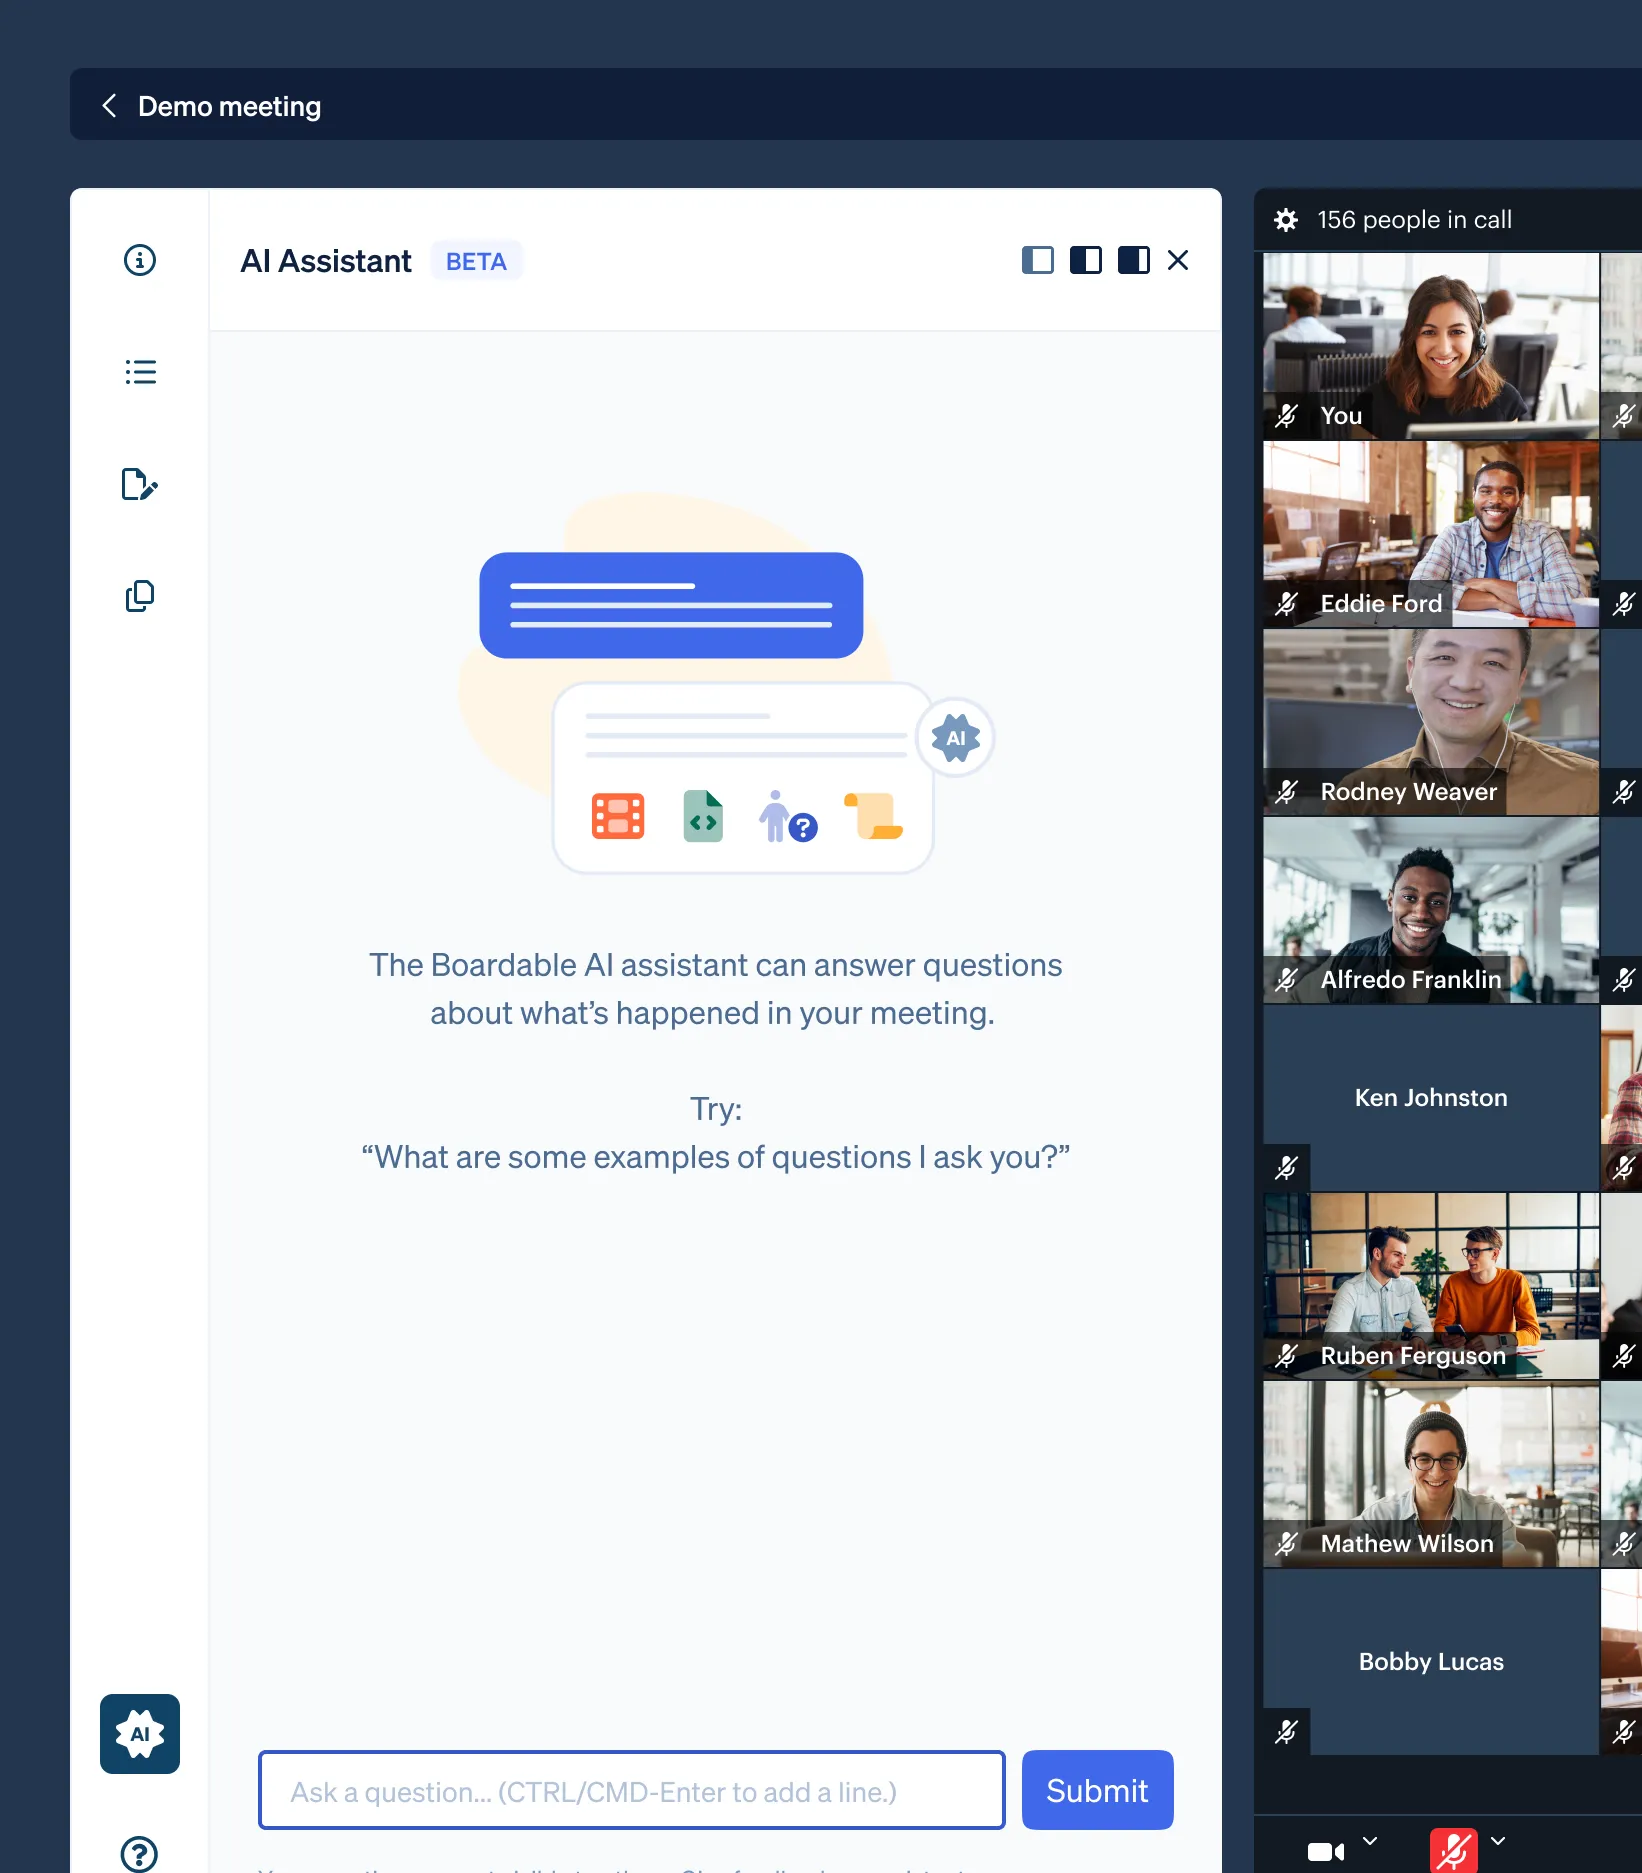
AI meeting assistant primary view
AI meeting assistant detail

Design Systems

Evolved a Sketch library into an integrated design system.

Worked closely with the front-end engineering team to develop a standardized style guide and component library. Evangelized design systems to designers and engineers.

BuildingConnected, 2018
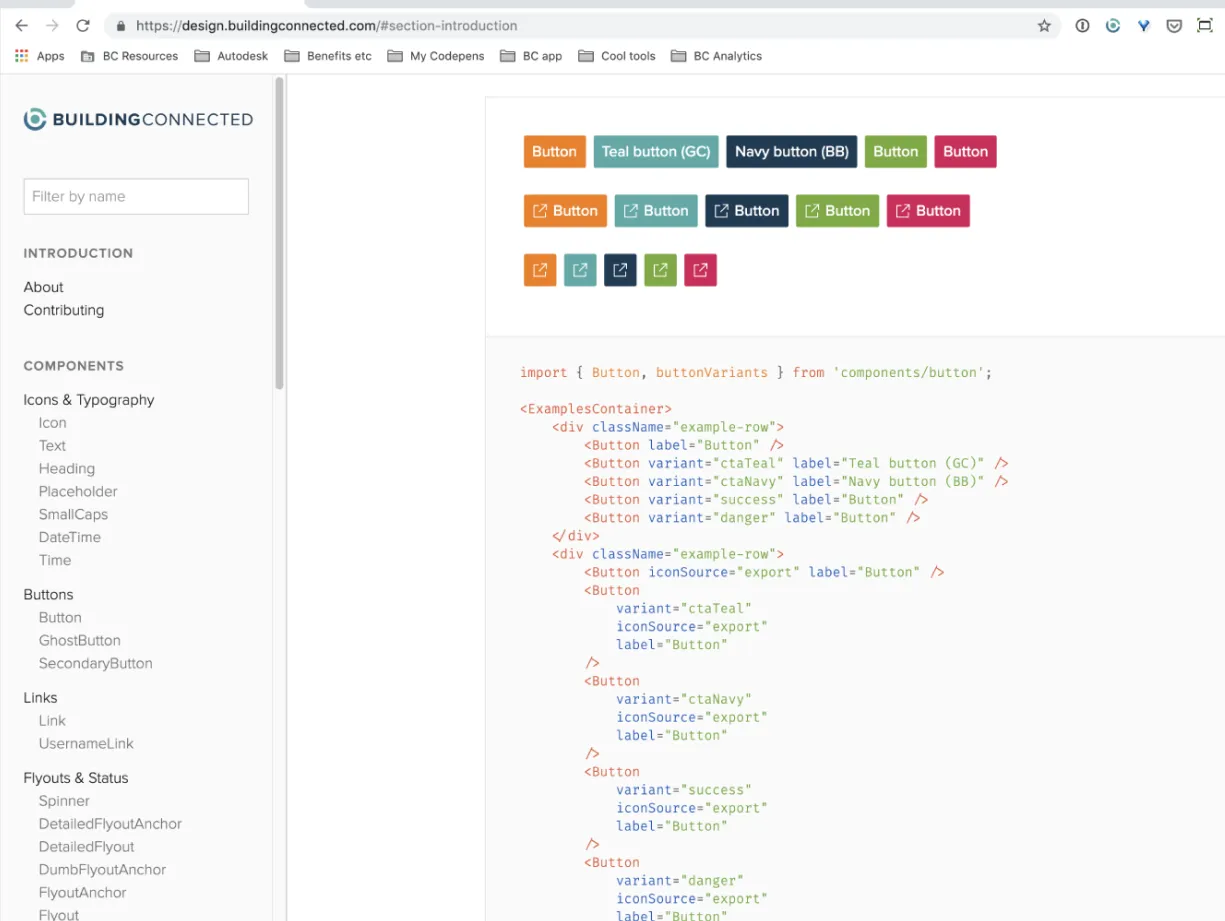
BuildingConnected design system site showing button variants and their React code
Design system Sketch library
Design system Styleguidist

OpenGov Network

Designed a way for governments to find and compare peers on the OpenGov network.

Delivered a new app for the OpenGov platform that strategically leveraged and promoted platform capabilities.

View a recreation of it here.

OpenGov, 2015
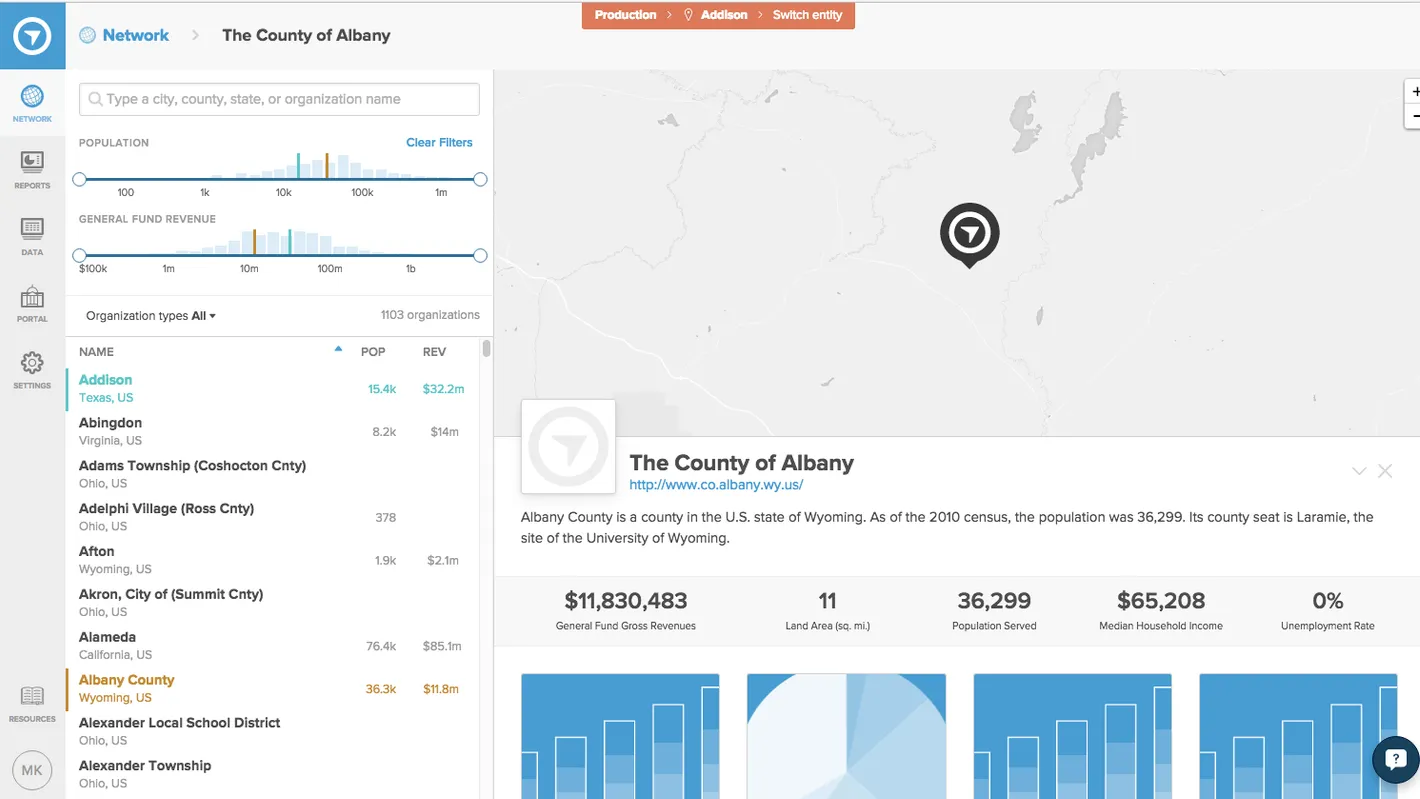
OpenGov Network map and searchable list of governments, with a profile of the County of Albany

Hightail Enterprise

Designed an admin feature that helped enterprise accounts meet e-discovery requirements, giving admins a simple yet powerful way to monitor activity.

Enabled the Hightail Enterprise offering, a new strategic line of business.

Hightail (formerly YouSendIt), 2014
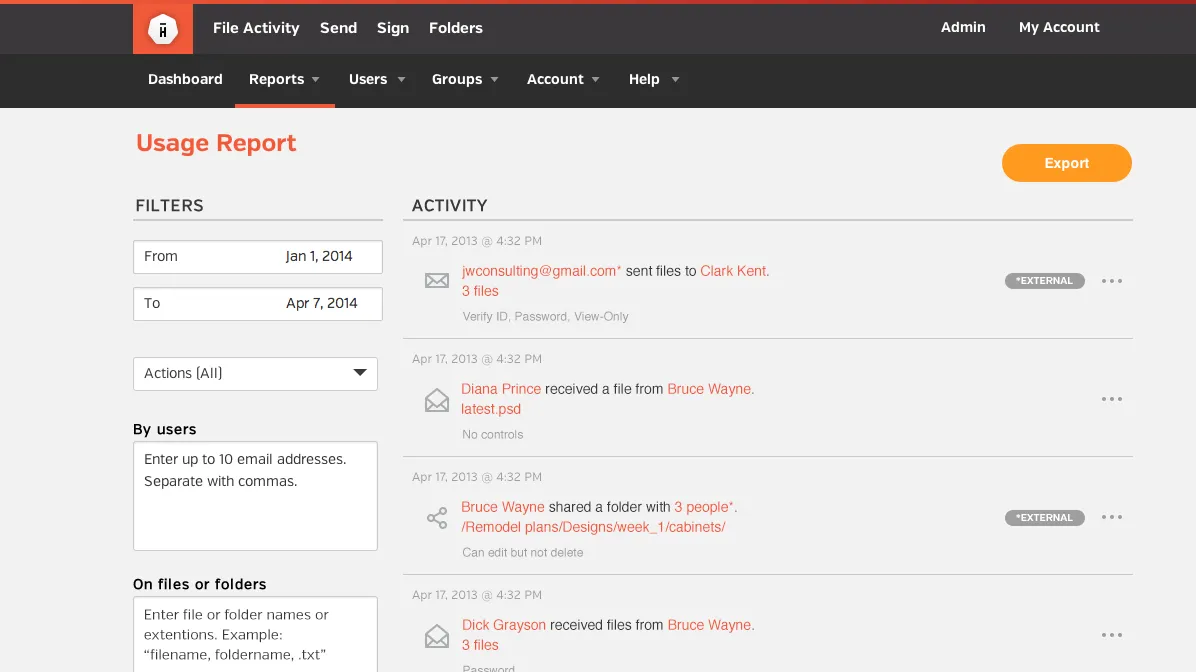
Hightail Enterprise reporting

Hightail Uplink

Championed reviving a popular legacy feature, then designed onboarding and engagement flows that added 8,000 users and 45,000 file sends in the first three months.

Hightail (formerly YouSendIt), 2013
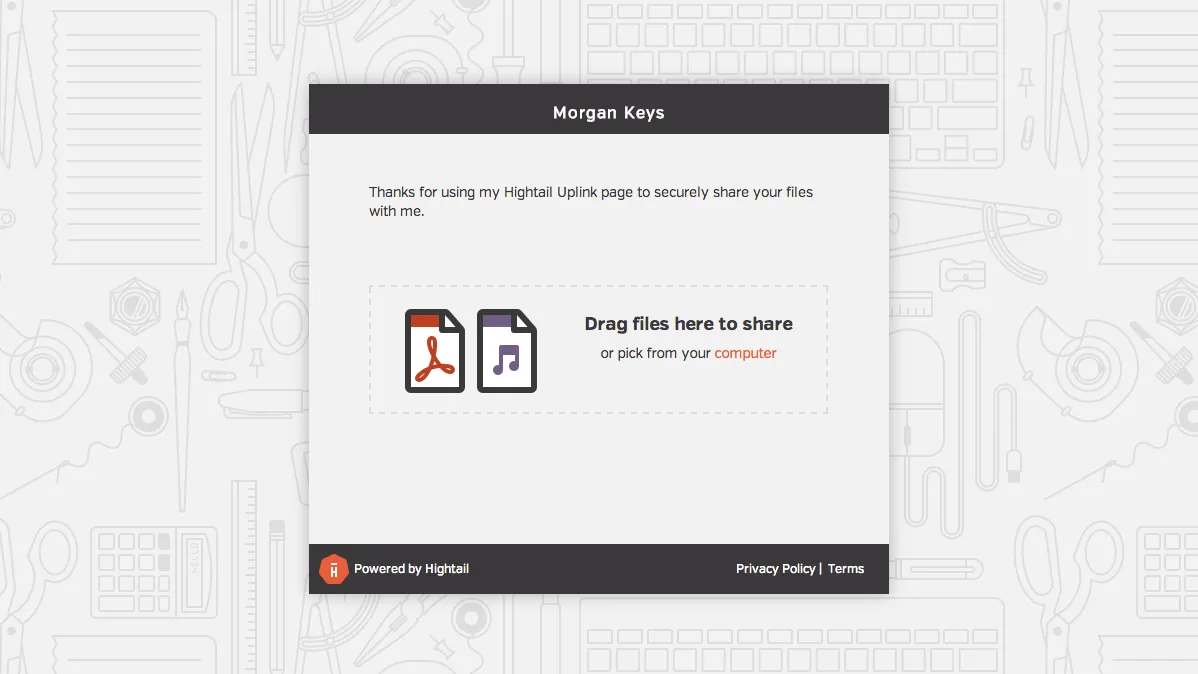
Hightail Uplink page where visitors drag and drop files to share

Ready to chat?

Find me on the socials:

Or shoot me a message: